NGC Drainage School – Storm Events
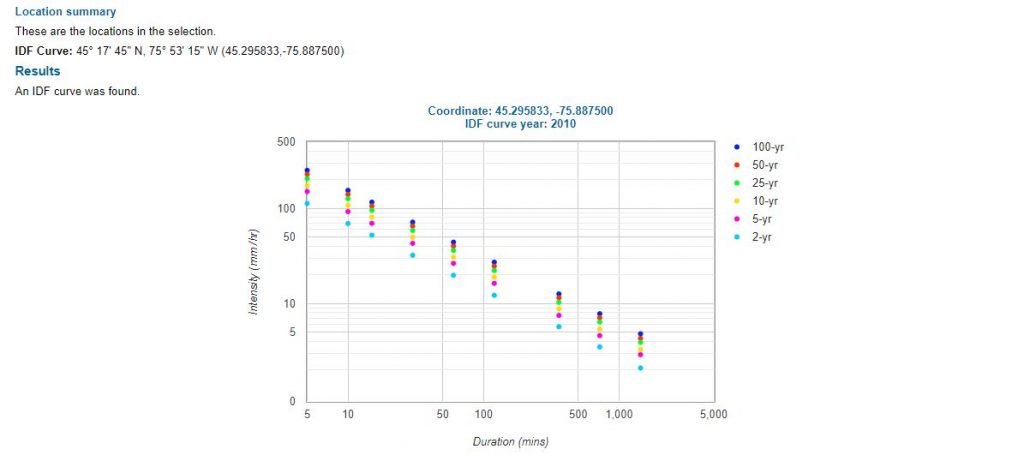
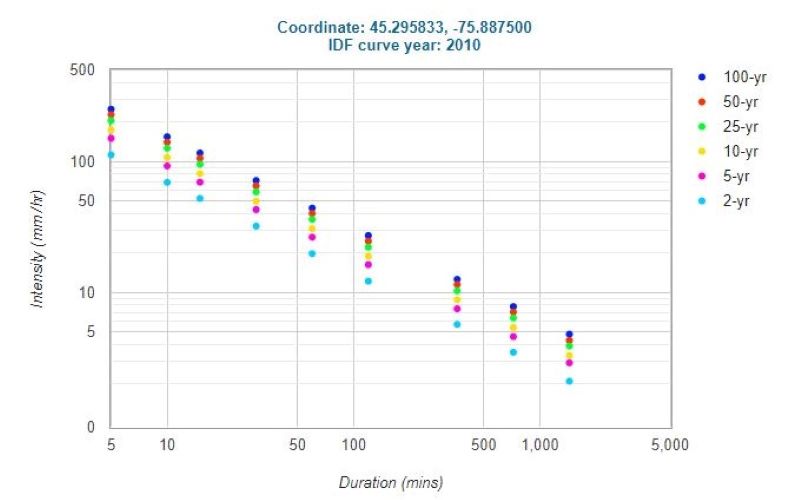
Pictured Above: An Intensity-Duration-Frequency Curve for Kanata, Ontario (http://www.mto.gov.on.ca/IDF_Curves/results_out.shtml?coords=45.295833,-75.887500)
If you are ever working with an engineer on a drainage solution or a stormwater management plan, you may hear them refer to “storm events” and “design storms”. These terms generally refer to recurrence rates; whether it be a 2-year, 5-year, 10-year, or 100-year storm event (or anything in between!). The one that is chosen as the criteria to meet for the project at hand will be the “design storm”.
A common misconception is that a 2-year storm event will only occur every 2-years. This is not true!
On the contrary, you can in fact have back-to-back 100-year storm events!
Instead, storm events refer to the probability of recurrence. For example, a 2-year storm event has a 1 in 2 chance of occurrence: or 50%. Similarly, a 5-year storm event has a 1 in 5 chance of occurrence – or 20%. And – you guessed it – a 100-year storm event has a 1 in 100 chance of occurrence – or 1%.
The rate of recurrence is based on historical rainfall data. Rainfall data is collected by local weather stations throughout Canada, including various stations throughout the Ottawa Valley. Various agencies throughout the Country, and within the province, have then converted the historical data into charts and equations that engineers can then use to estimate rainfall when preparing design solutions. These results are then called Intensity-Duration-Frequency curves (or IDF curves for short)!
A Note About Intensity
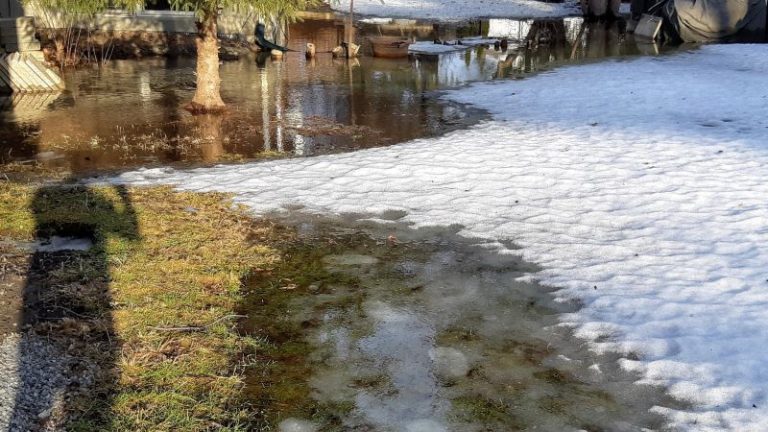
A key component to storm events are the intensity; that is to say – how quickly the rain falls from the sky. Storm events are a function not only of how much rain fell – but also how quickly it fell. For example, if you live in Kanata and 24 mm of rain fell over a 2-hour period; that may only be a 2-year storm. But if that same 24 mm fell over a 10 minute period – that might be a 100-year storm event! It’s often difficult to assign a storm event category based solely on historical daily data, as the data generally does not include the time over which it fell.
Curious about what the different storm events look like for your area? Check out the Ministry of Transportation of Ontario’s “IDF Curve Lookup”.
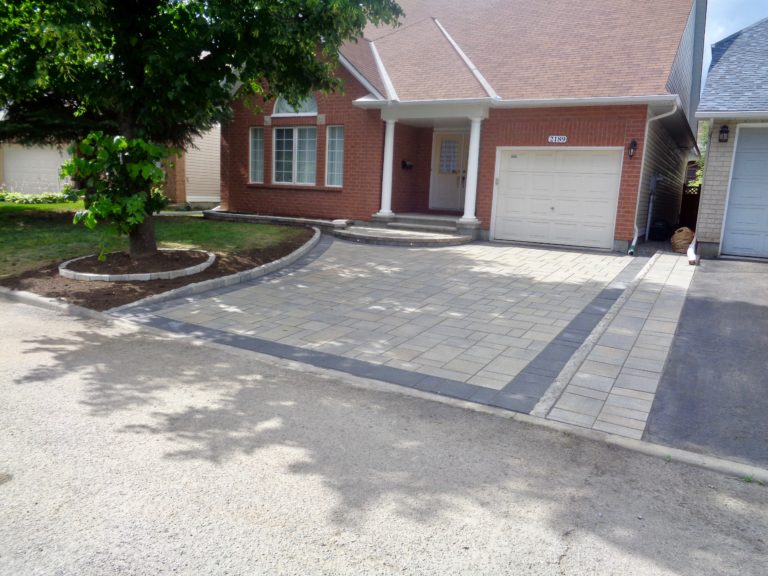
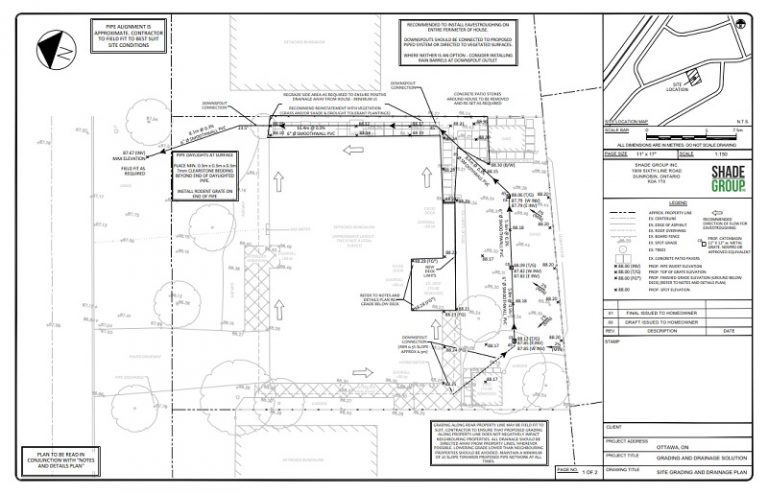
If you have drainage problems on your property and would like professional help – our in-house engineering design team can assist! If you’re in need of a stormwater management plan for Site Plan Approval – we can help!
Reach out today to see how we can be of service! Please call (613) 894-8683 or fill out our online form and we’ll get right back to you.